Japanese candlesticks are the most popular and convenient way to display price movements. They allow traders to quickly understand what happened with an asset over a chosen time period and assess overall market sentiment.
What does a candlestick show?
Each candlestick represents price movement for a selected period (1 minute, 15 minutes, 1 hour, 1 day, etc.).
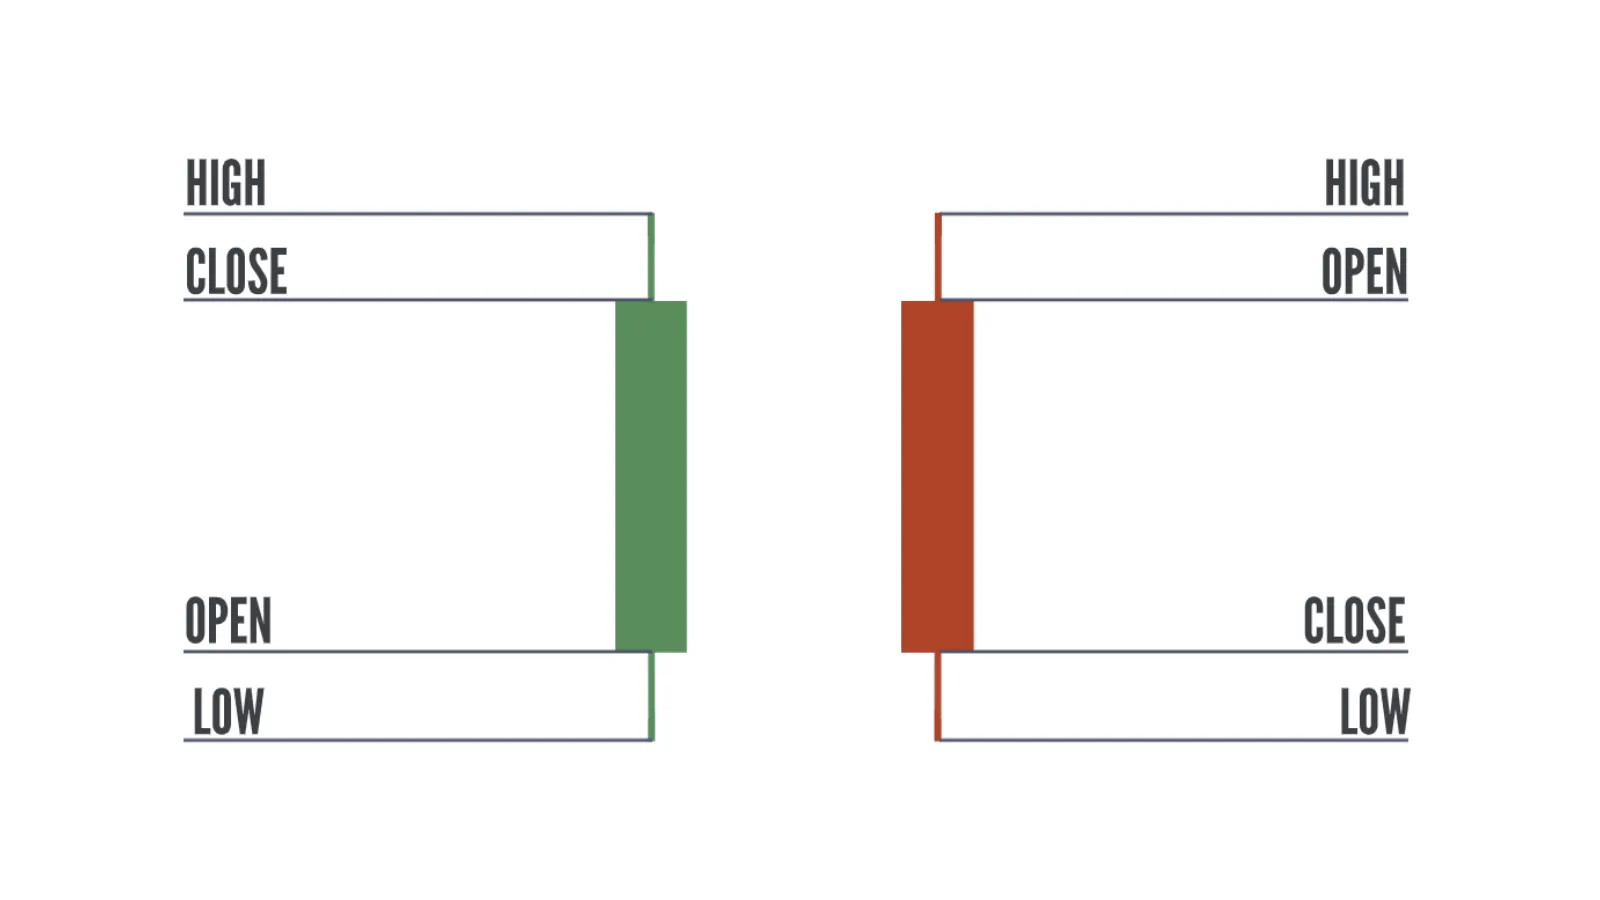
Elements of a candlestick:
Body — shows the opening and closing prices for the period.
Wicks (or shadows) — show the highest and lowest prices during the same period.
Candlestick colors:
Bullish candle (upward): closing price is higher than the opening price. Usually green or blue.
*Bearish candle (downward): closing price is lower than the opening price. Usually red or orange.
How to read a candlestick?
Green candle: buyers are stronger than sellers → price rises.
Red candle: sellers are stronger than buyers → price falls.
Long body: strong movement in one direction.
Short body: weak movement, price fluctuating in a narrow range.
Long wicks: high volatility but uncertainty (price moved significantly but failed to hold those levels).
Why are candlesticks more useful than other charts?
Unlike simple line charts (which only show the closing price), candlesticks provide four key prices:
- Opening
- Closing
- High
- Low
This is known as an OHLC chart (Open-High-Low-Close).
Example:
An hourly candlestick:
The body shows the opening and closing prices within that hour.
The wicks show the highest and lowest prices during the same hour.